From La Jolla to Downtown — 12 of San Diego's most in-demand neighborhoods, $73K average annual revenue across 8,000+ listings, and a local team that knows every block. We help owners maximize revenue while delivering five-star guest experiences.
We handle everything from listing optimization and dynamic pricing to guest communication and local maintenance — so you can earn more and stress less.
Skip the booking fees and get the best rates when you book directly with us. Every property is professionally managed and guest-ready.
60+ miles of coastline, year-round mild weather, and one of the country's most diverse tourism markets keep San Diego STR demand strong in every season.
Market data represents estimates based on publicly available STR research aggregated across San Diego. Individual property and submarket performance varies significantly — see each neighborhood page below for detailed local stats.
Smart pricing strategy means capturing premium rates June–August while filling the slower winter months that most managers leave empty.
Peak season (June–August) drives $8K–$10K/month in average listing revenue across San Diego. Our dynamic pricing engine adjusts nightly rates in real-time so you capture every dollar during high season while maintaining competitive occupancy through the winter trough.
Each submarket has its own guest profile, pricing dynamics, and demand drivers. Click through for detailed performance data on the 12 neighborhoods we manage.
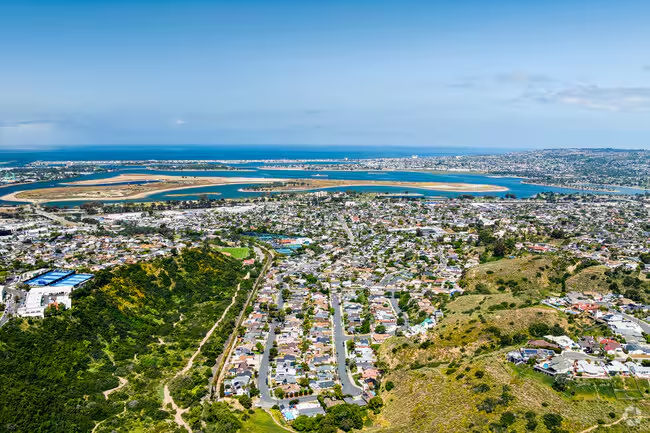
Hillside streets with Mission Bay sunset views, minutes from SeaWorld and Pacific Beach.
View details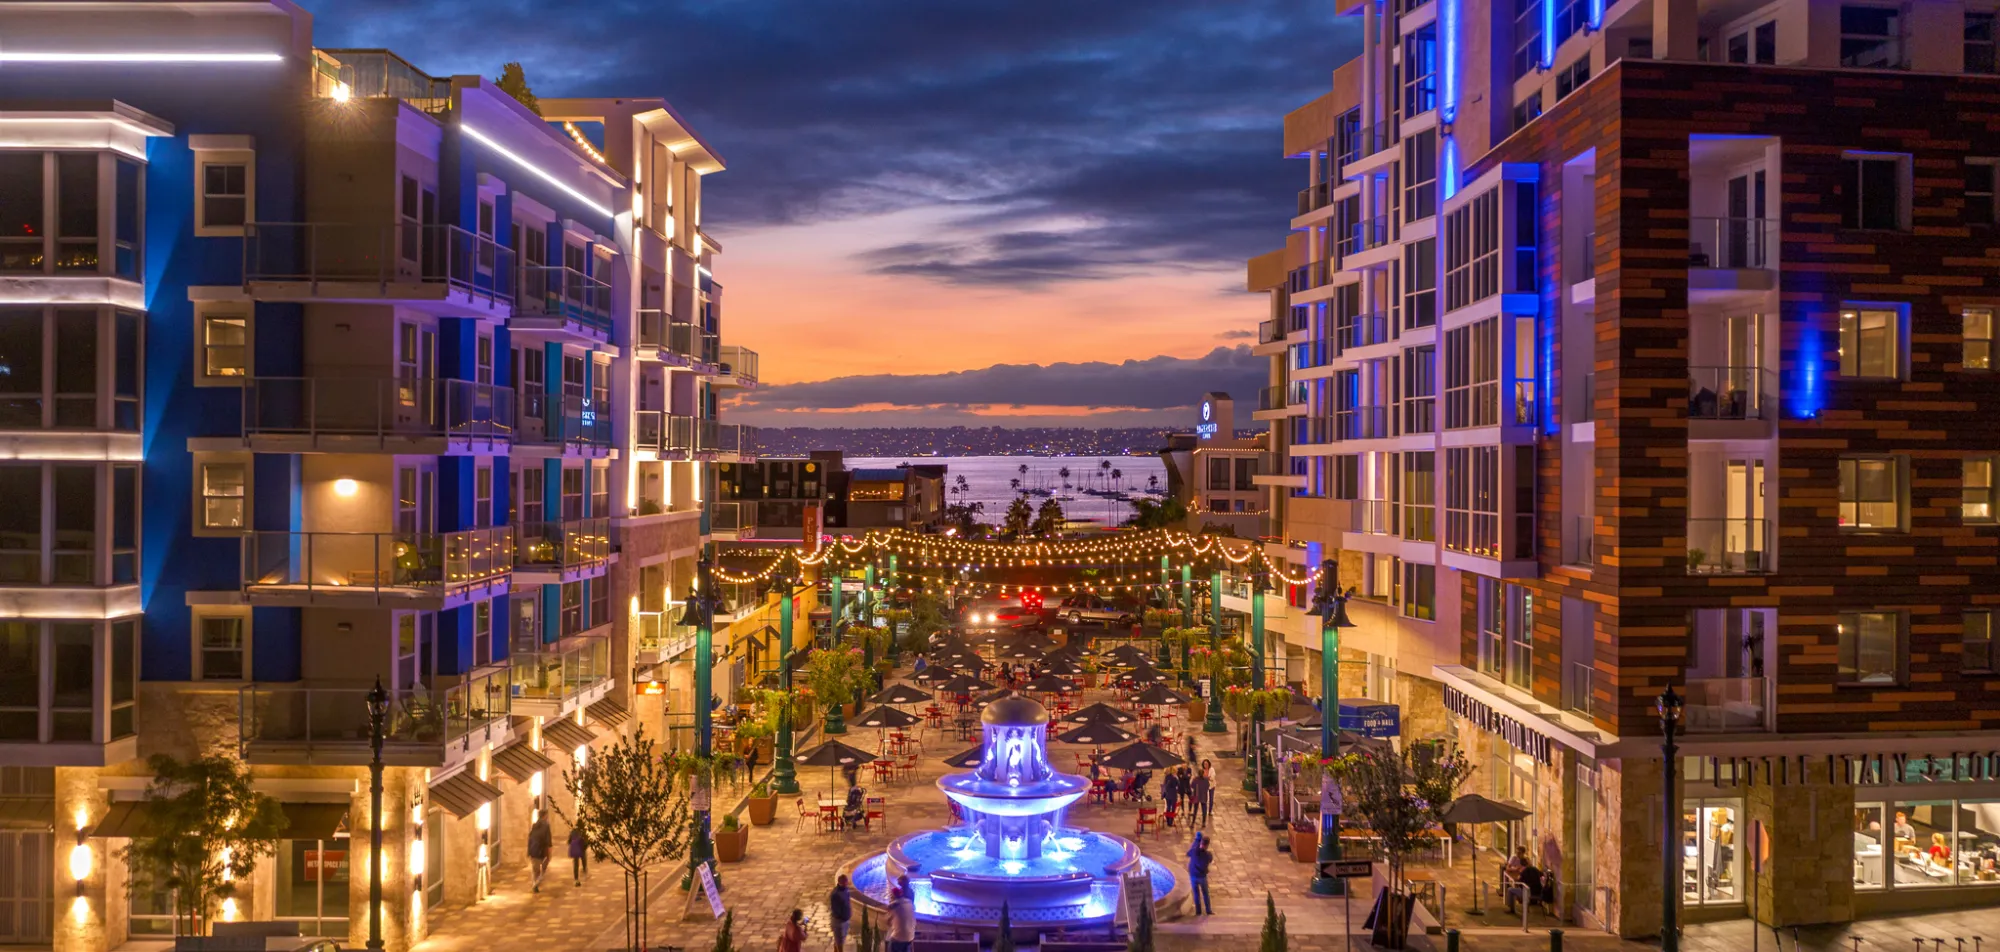
The urban core — restaurants, nightlife, Petco Park, and the Convention Center.
View details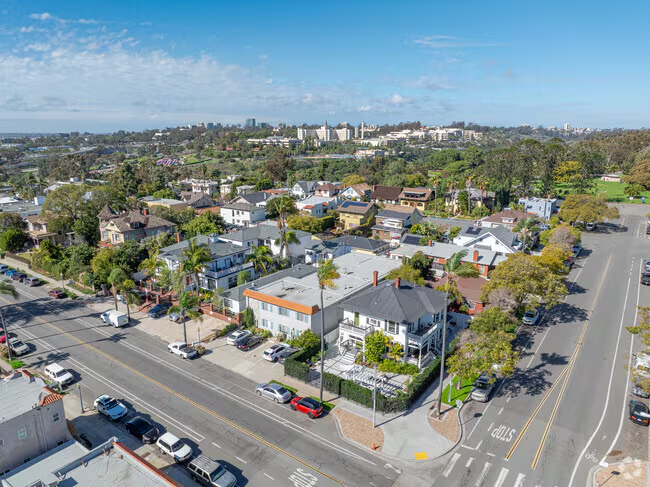
Victorian architecture and indie coffee steps from Balboa Park and Downtown.
View details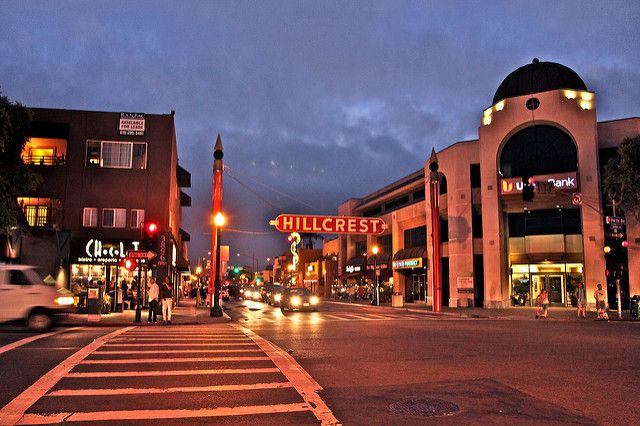
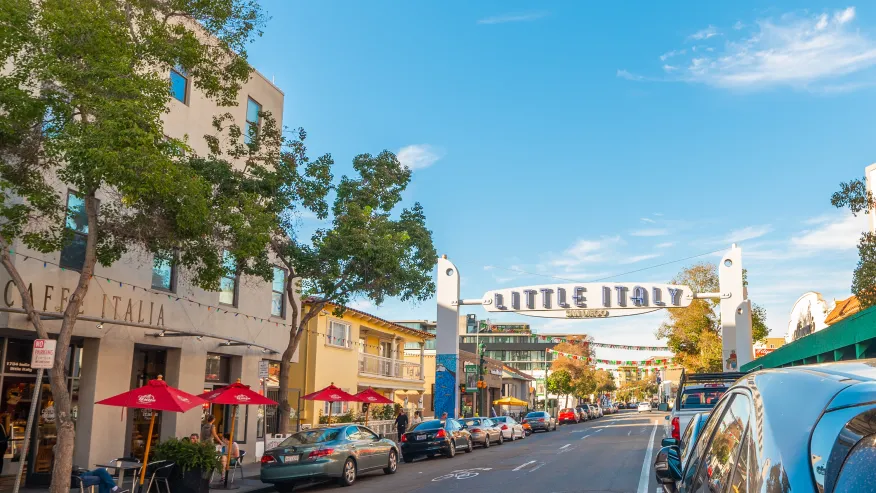
Uptown's most walkable food and cultural neighborhood, bordering Balboa Park.
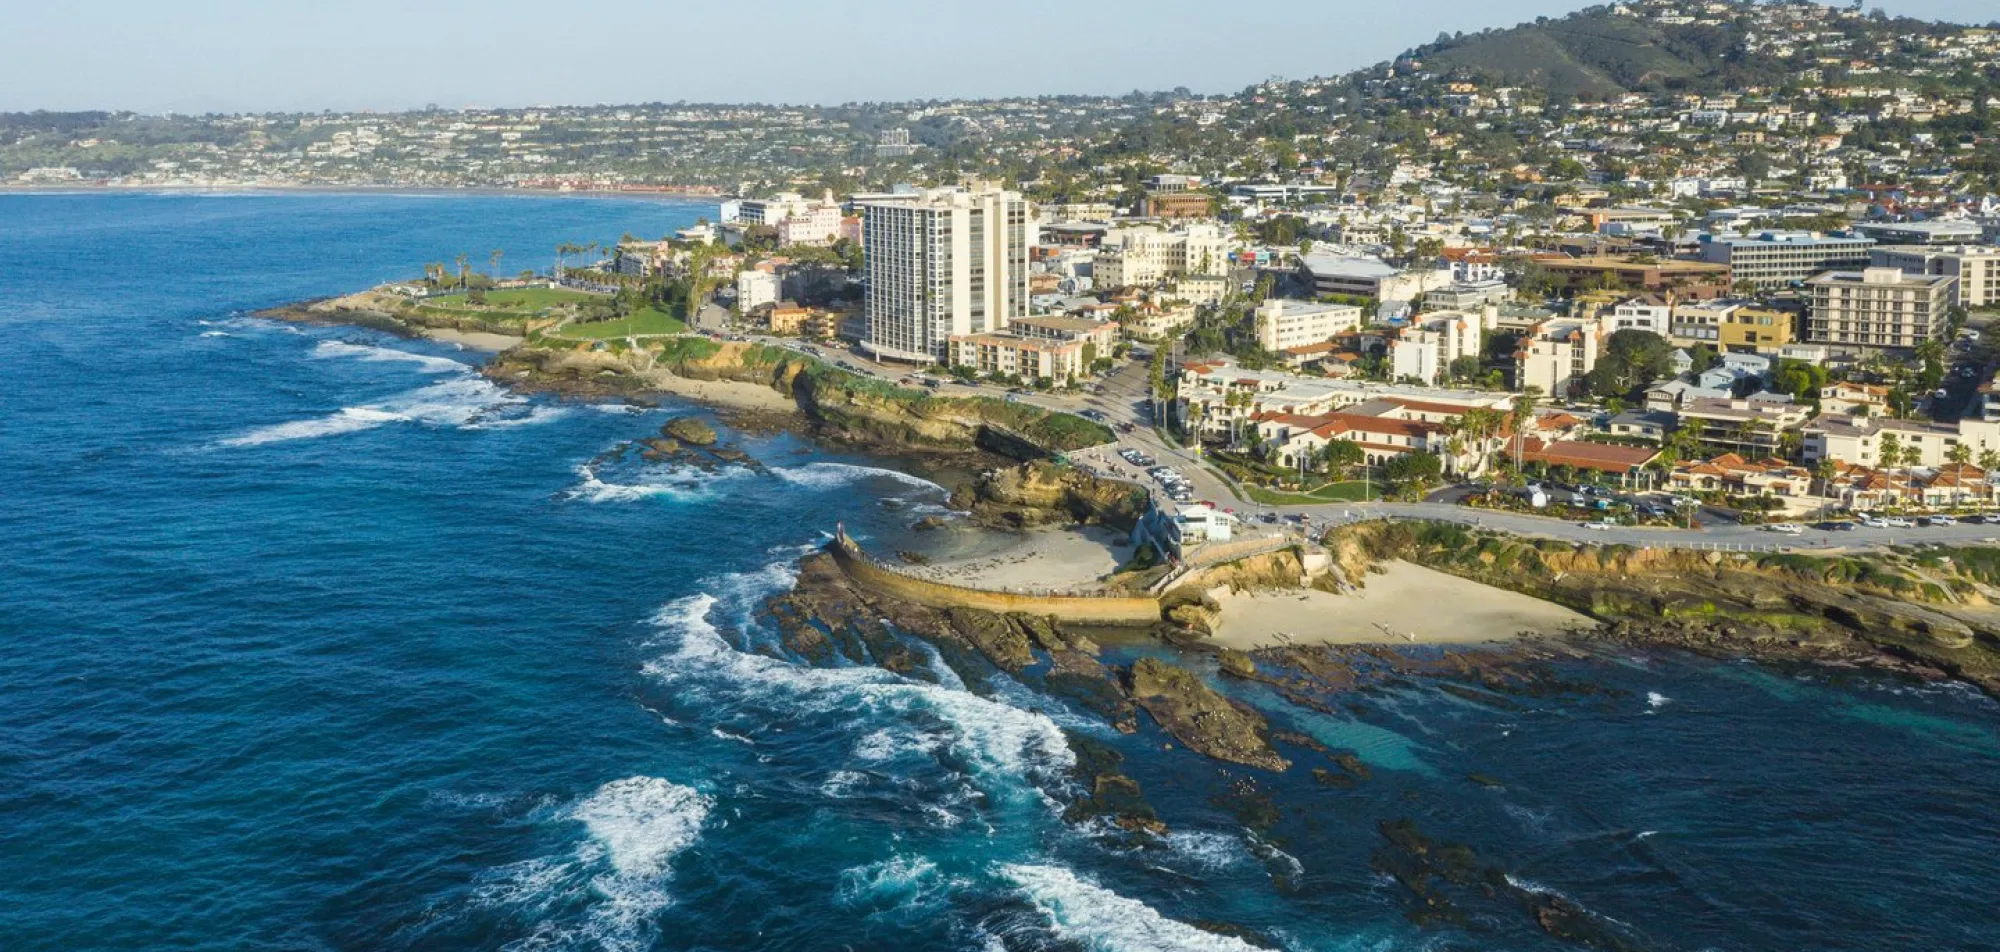
View detailsCoastal village with stunning ocean views, fine dining, and the iconic La Jolla Cove.
View details
Ocean on one side, Mission Bay on the other, and Belmont Park in the middle.
View details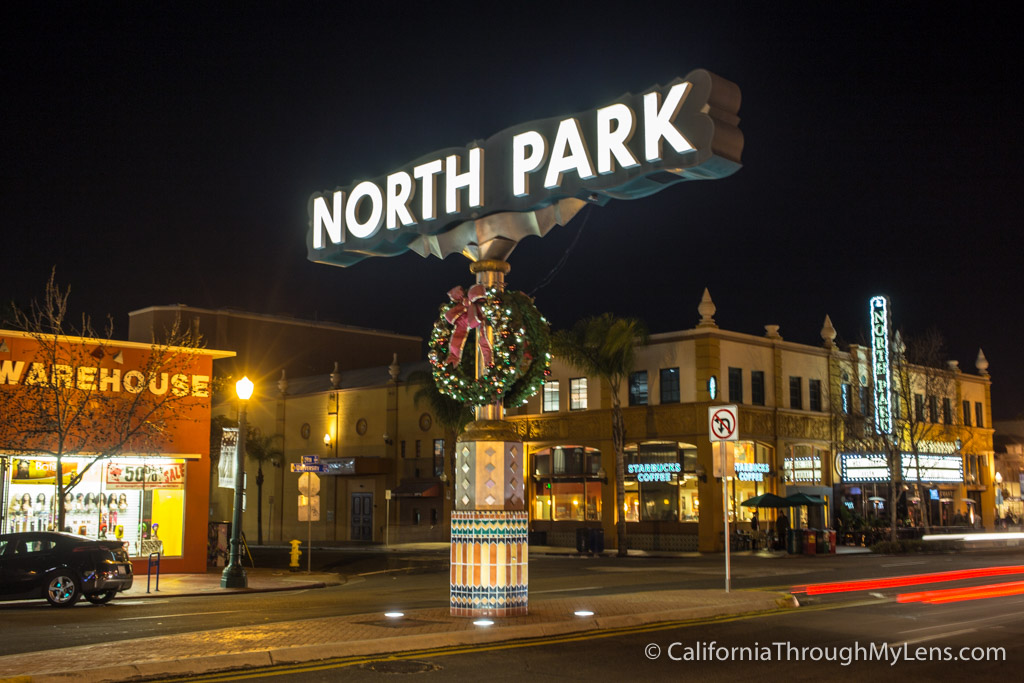
Craft breweries, indie coffee, and San Diego's most walkable urban neighborhood.
View details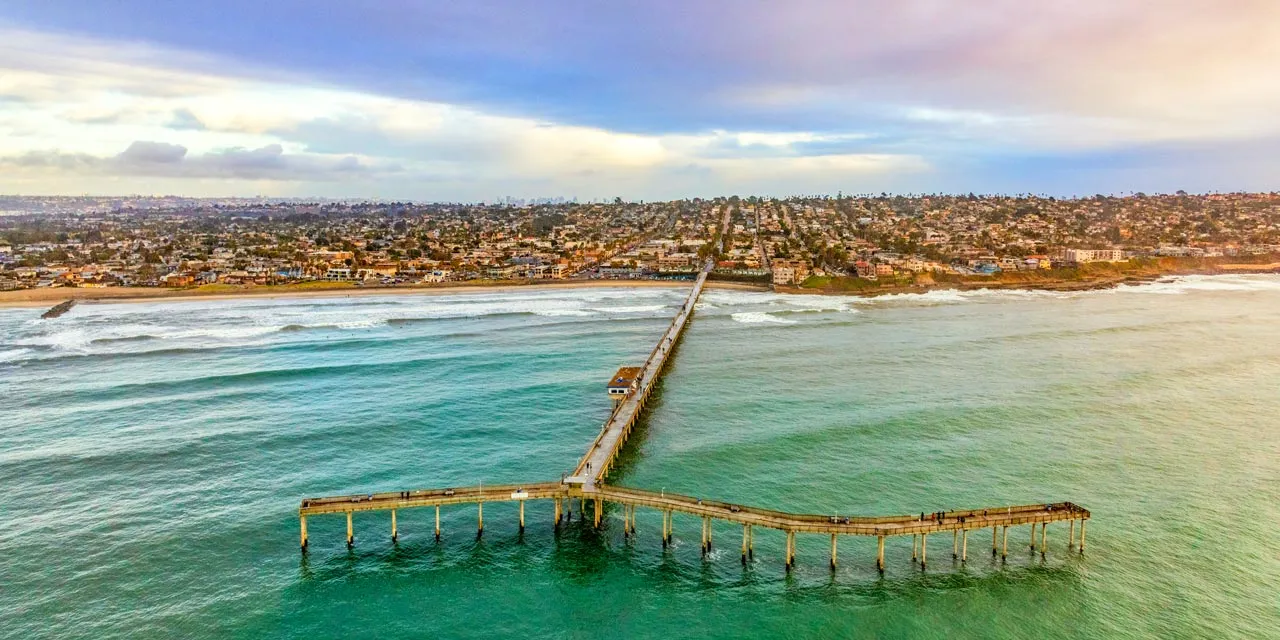
Dog-friendly beaches, Sunset Cliffs, and laid-back coastal charm with loyal repeat guests.
View details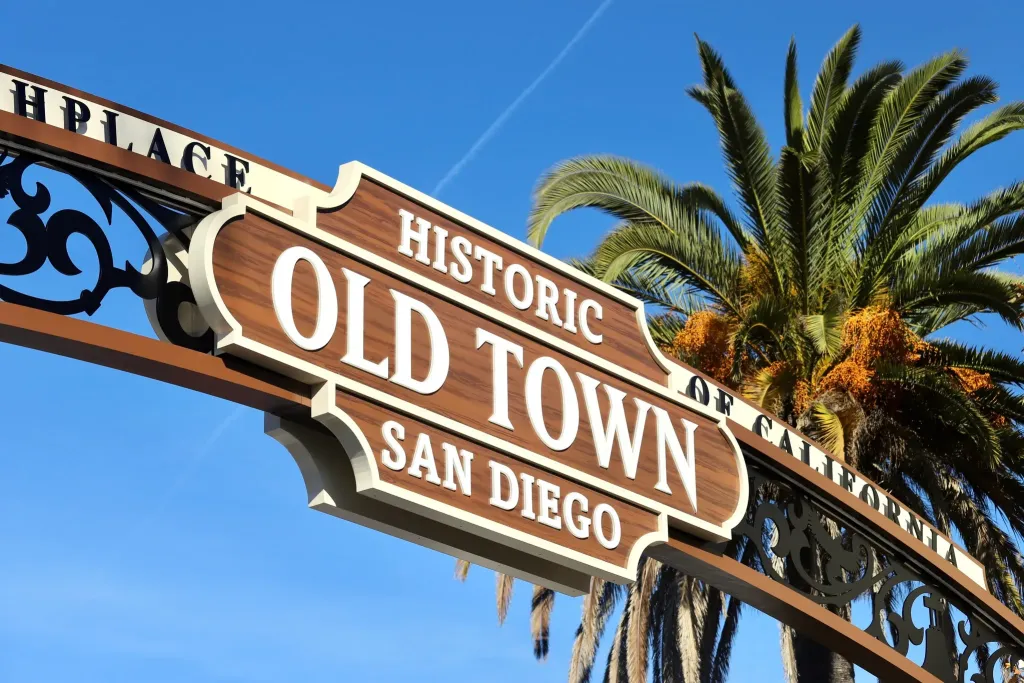
Historic birthplace of California — walkable plazas, authentic Mexican dining, airport access.
View details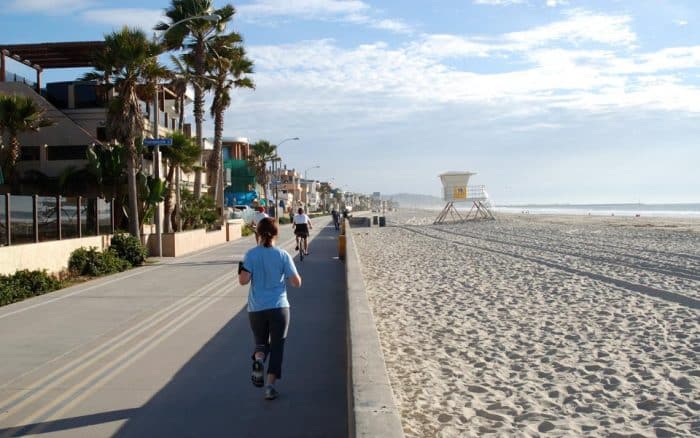
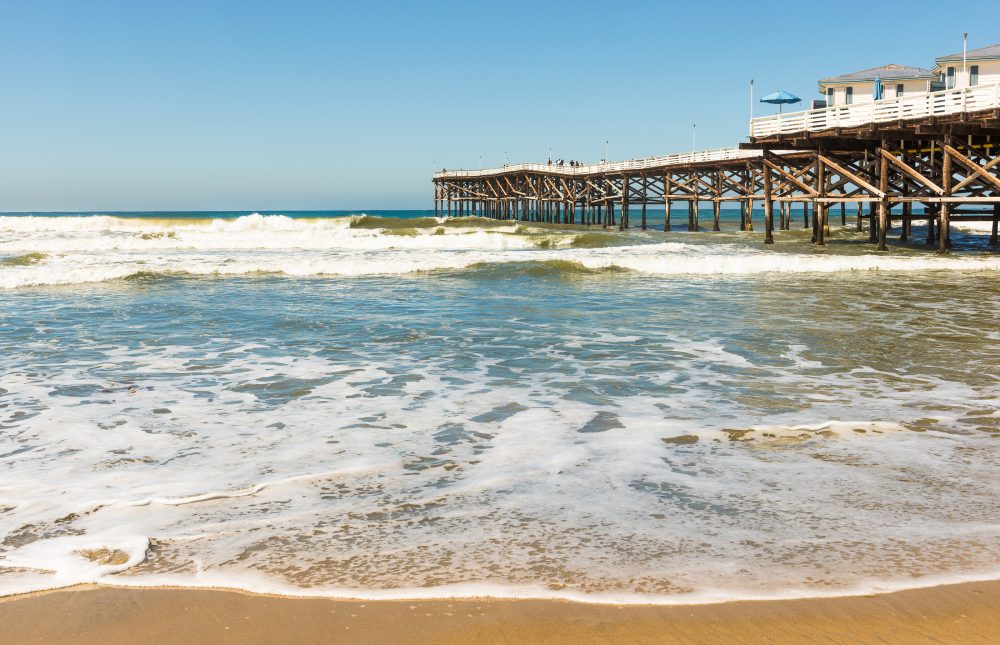
Youthful beach energy with Crystal Pier, Mission Bay, and a 90/100 rental demand score.
View details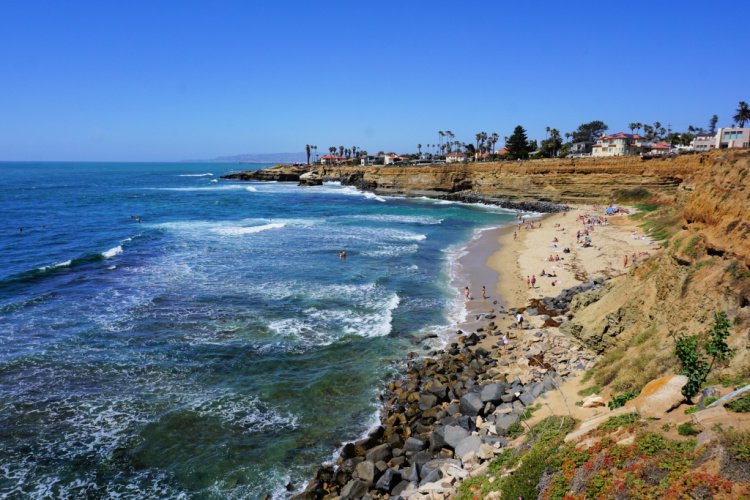
Dramatic ocean bluffs and premium ADR — San Diego's highest-revenue submarket.
View details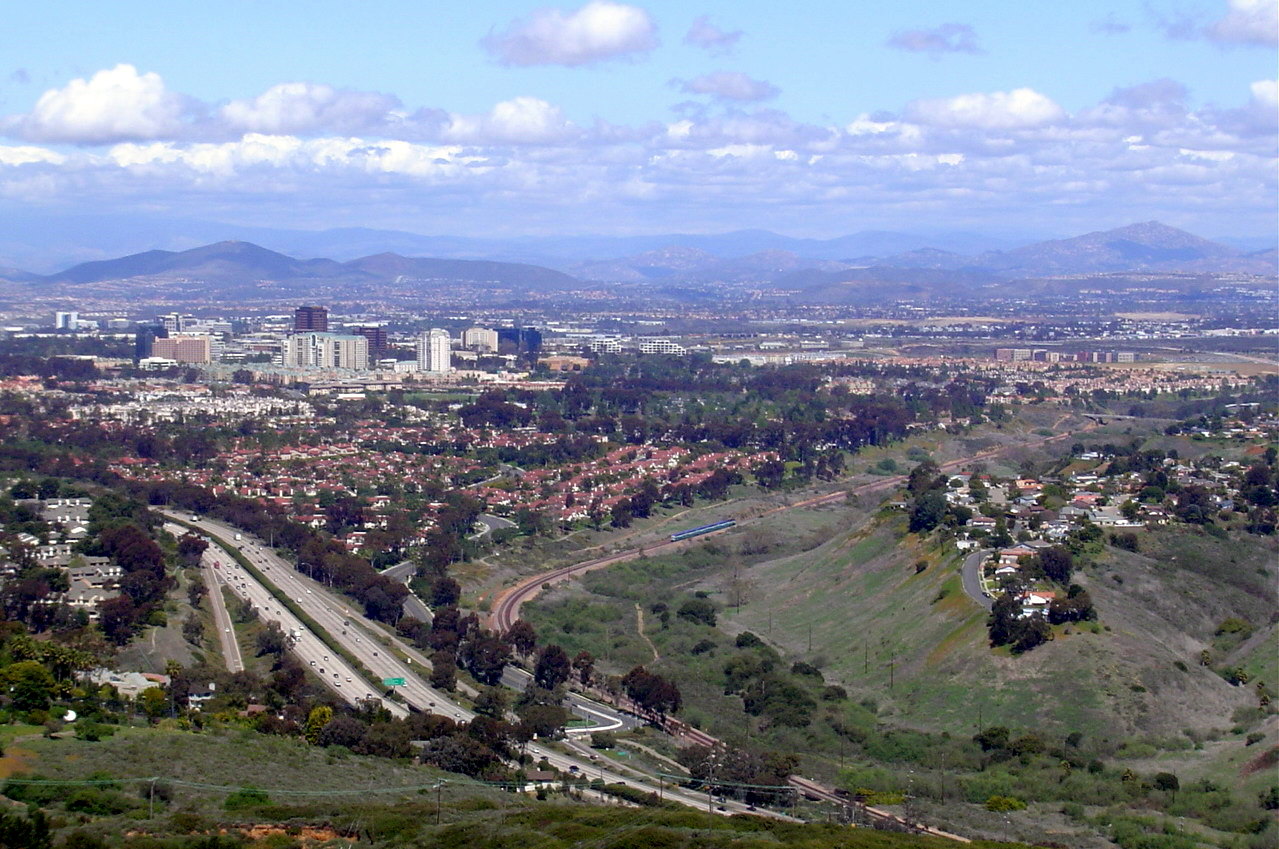
Next to UCSD and Westfield UTC — +13% revenue growth with all indicators trending up.
View detailsFrom Torrey Pines to Coronado, San Diego's beaches anchor the entire STR market. Ocean proximity is the single biggest driver of nightly rates across every coastal submarket.
The country's largest urban cultural park anchors downtown with the San Diego Zoo, 17 museums, and year-round festivals — a core demand driver for Hillcrest, North Park, and Golden Hill.
Comic-Con, Padres home stands, Pride, major conferences, and the San Diego Convention Center drive predictable demand spikes worth premium nightly rates when priced right.
Average 70°F and 260+ sunny days keep occupancy strong even in the off-season — something most STR markets in the country can't match.
Get a free, no-obligation revenue projection for your property. We'll show you what your home could earn under professional management — backed by our 3-month money-back guarantee.